Global


Copyright@ Australian Catholic University 1998-2026 | ABN 15 050 192 660 CRICOS registered provider: 00004G | PRV12008
Copyright@ Australian Catholic University 1998-2026 | ABN 15 050 192 660 CRICOS registered provider: 00004G | PRV12008

In an underground coal mine in China, an environment that’s among the most hazardous workplaces on earth, the methane gas that seeps naturally from coal seams can ignite with devastating consequences. Danger escalates quickly, decisions must be made fast, and the stakes of a missed warning could hardly be higher.
On a December afternoon at one such mine in the Shanxi coal-producing region, the methane readings were climbing. So was the temperature. Individually, neither had crossed the line into danger territory – but together, they were starting to tell a different story.
On a monitor above ground, a coloured circle was drifting slowly toward the upper limit of its safe range. At 3.27pm, it crossed that limit. The bubble turned yellow, a signal that would give the mine’s safety team a warning – and a decision to make.
The warning came from a deceptively simple tool designed to reduce complex streams of real-time hazard data into a single, readable symbol.
It’s called the Bubble-Wall Plot, and it was developed by a team of researchers including Professor Niusha Shafiabady, the head of ACU’s IT discipline and Director of its Women in AI for Social Good Lab.
In their study, published in PLOS One, she and her colleagues describe how the plot can be handily used to develop visual warning systems in high-stakes environments where complexity can prove fatal.
“In these high-risk situations, if you miss something, it can cost human lives,” says Professor Shafiabady, who undertook the research alongside a team of computational intelligence experts, including Dr Robert Wu from the University of Technology Sydney.
“If the system is too complex, if someone is tired or under pressure, even an expert, it might make it very difficult for them to make sense of what’s going on. It’s crucial to be on time and to provide some kind of interpretability to the hazards.”
At their simplest, data visualisation tools based on the Bubble-Wall Plot consist of one circle and two lines. The lines define a safe zone – an upper and lower boundary for whatever variable is being monitored.
When conditions are normal, the circle – or bubble – sits within that zone. When it crosses the boundary, it changes colour: blue for safe, yellow for anomaly, red for warning.
The logic is immediate and instinctive, Professor Shafiabady says, making it relatively easy to interpret.
“We were looking to create something that achieved that need for simplicity, displaying the changes over time in a way that could be understood by an inexperienced user.”
When exploring existing data visualisation tools, the research team discovered a consistent problem: they were either too complex for easy interpretation, or too static to reflect what was happening in real time.
Their goal was to create a tool that would overcome these shortcomings.
The team collected continuous real-world data from gas and temperature sensors at the Zhongxing coal mining site, combining these variables into a single weighted index. The complex datasets could then be collapsed into one number, with the bubble’s colour change providing a signal to the end user.
It sounds simple, but the truth is that developing the tech was no walk in the park.
“What we had to do was to come up with a model that would effectively predict the hazards in real time with the best accuracy possible using all the available data,” Professor Shafiabady says.
“It really took a lot of work to come up with a system that was comprehensive, accurate and reliable, but also simple enough for a person who isn’t a data scientist to understand and interpret the results.”
When a safety threshold is crossed, as in the above-described coal mine scenario, the next step is a human decision, made in real time and based on the best available information.
This, says Professor Shafiabady, is one of the most important things to note about warning systems based on the Bubble-Wall Plot: they’re designed to support human judgment and decision-making, not replace it.
Though the coal mine case study proved the concept, the technology’s real power lies in its adaptability.
Beyond coal mines, the researchers have explored potential applications in oil and gas, where sensor data can flag pipeline corrosion before it becomes catastrophic, and in healthcare, where it could apply to diabetes patients connected to an insulin pump, with the tool responding as blood sugar moves towards dangerous levels.
The logic is straightforward: identify the variables that create or signal risk in a given environment, establish safe boundaries for them, and put the model to work.
“As long as we have a system that we have data on,” Professor Shafiabady says, “we can come up with some kind of creative AI methodology to predict all kinds of hazards using different models.”
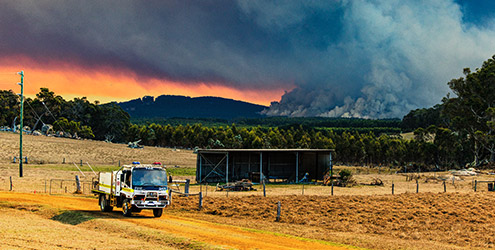
She also describes more vivid scenarios closer to home, like summer bushfires during the punishing extremes of heat and drought that are common on our continent, or keeping tabs on shark risk at our crowded surf beaches. In the latter example, inputs like tagged shark data, drone sightings, and environmental factors like murky water and the presence of baitfish could be synthesised into a single visual indicator for lifeguards.
The tool would function less as a predictive system and more as a live monitor, translating a stream of incoming information into a visual that tells a story.
Professor Shafiabady even imagines a public-facing sign on the promenade, its colour shifting with the risk level, giving beachgoers information before they decide on whether to enter the water.
“In the beginning, people might find such a thing to be a bit odd,” she concedes, “but after a while, they’d get used to it and start to understand how to use it and what it means.”
Underlying this technology is a philosophy that Professor Shafiabady returns to repeatedly. Even the most sophisticated tools are next to useless if people can’t make sense of what it’s showing them.
This has become more pressing as data systems have grown richer and more complex. The field of explainable artificial intelligence, which seeks to make algorithmic decision-making legible to human users, has expanded rapidly in recent years – and for good reason. A system that produces accurate outputs but buries them in complexity can have serious limitations.

“AI empowers people and organisations by analysing large data sets quickly and accurately, enabling faster decision-making – but we don’t want to just rely on an algorithm,” Professor Shafiabady says
She points to her recent co-authored study, published in Sensors, and its finding that the first ‘hype cycle’ of AI development prioritised tech above humans. The movement towards explainable AI is aimed at illuminating how algorithmic models make decisions, with more transparency and interpretability.
“If the end user can’t make sense of the ‘why’ behind a decision, it’s not a good solution,” says Professor Shafiabady, whose expertise in the field of AI and computational intelligence is internationally recognised.
“I think the most dangerous thing about AI is the risk that people move towards losing their ability to think and analyse. We don’t want that to happen.”
It’s a principle that runs through much of Professor Shafiabady’s work in this space: a statement that new technologies like the Bubble-Wall Plot should be made with people in mind.
For her and many of her colleagues, the question of how technology is designed is inseparable from the question of who it’s designed for. When developed ethically and used responsibly, such technologies can be a force for good.
“If we follow these principles and ensure that the systems we build are human-centred and human friendly, we will stand on safe ground. We’ll develop tools that make complex things easier – and in the moments that matter most, we may even save lives.”
Passionate about data and tech? Explore our courses.

Copyright@ Australian Catholic University 1998-2026 | ABN 15 050 192 660 CRICOS registered provider: 00004G | PRV12008